Finding Clusters in the London Startup Scene
Over the past decade London has emerged as one of the leading startup ecosystems globally. How is London differentiated from other startup hubs? What are its strengths and what are the themes that drive its growth? In this post I look at some data about the London startup ecosystem to try to answer some of these questions.
End of last year when I was considering the move to venture capital, I had a little play with some data from AngelList's API. This post is an improved version of that analysis published as an ipython notebook. Data tells amazing stories and it was exciting to see how companies I've grown so familiar to over the past year crop up here and there in the analysis. But there were also a few surprises and hidden gems, that prove the power of this data.
Results: my analysis revealed that there are a number of coherent clusters and themes that London appears to be particularly strong at. Not surprisingly, these build on industries that London has been traditionally quite strong at: finance, media and commerce. Here is the list of clusters I identified with the top 3 associated markets and a couple famous examples in each sector. Please read on if you're interested in methodology.
- fintech (financial services, finance technology, finance)
- e-commerce , (e-commerce, fashion, marketplaces)
- digital media/marketing, (digital media, social media, mobile)
- mobile apps (mobile, location based services, education)
- marketplaces/analytics, (marketplaces, education, advertising)
- SaaS/enterprise, (SaaS, enterprise software, mobile)
- social apps (social media, mobile, social commerce)
Methodology
My goal was simply to understand the data, to identify any patterns or useful summaries that provide some insight on how the space is organised. In machine learning this is called unsupervised learning, in contrast with supervised learning where the goal is to predict a particular target variable such as price or probability of churn.
Visualisation: Laplacian Eigenmaps
The first step in almost any machine learning investigation is to visualise and map data. I decided that I will use one of the most versatile visualisation techniques I know of: Laplacian Eigenmaps. This is a powerful yet simple tool that works on small to medium sized data.
At the heart of Laplacian Eigenmaps is the concept of similarity between set items. In my case I had to define similarity between any two startups. The Laplacian Eigenmaps algorithm then automagically creates a map placing similar items closer together.
AngelList associates market tags to each startup on their platform. These describe markets a startup operates in: for example e-commerce, finance or social media. These tags — about 500 of them — are manually added and I found them reliable. Often, there are tags with overlapping meaning, such as finance and financial services. People use these interchangeably, making raw data hard to work with. So my analysis somehow had to take care of this.
I ended up using cosine similarity between the sets of market tags to define how similar two startups are. This is a standard choice used in information retrieval and search engines to define how similar any website is to your search query. Importantly, it works fairly well for documents of different size. In this case this is important as startups have different number of market tags associated with them.
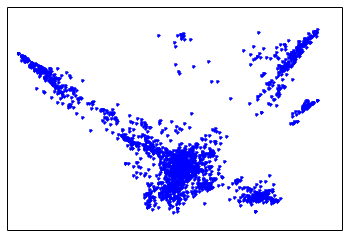
Here is the figure that Laplacian eigenmap creates using this similarity. Each dot corresponds to a startup in the dataset, and the algorithm lays out the dots so that similar ones end up closer to each other.
Spectral Clustering
When I looked at the figure that Laplacian eigenmaps produced, one thing was immediately clear: the data separates into 5-10 distinct clusters. So my next task was to identify these clusters.
For clustering I decided to use spectral clustering. I could've used any other clustering algorithm, k-means, hierarchical, whatever. But I knew that spectral clustering uses similar maths to Laplacian eigenmaps, thus it is likely to identify the same clusters as the ones already visible on the figure I had. Besides, it's quite a powerful technique and readily implemented in scikit-learn machine learning package.
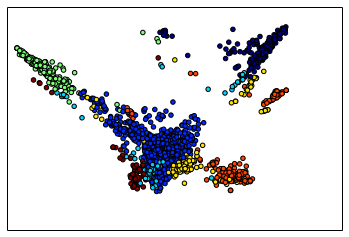
So I ran spectral clustering with $k=7$ clusters and drew this colourful plot:

I looked at the top 3 most popular market tags associated with each cluster to come up with some sort of label for each cluster. I also looked at the most followed (on AngelList) companies in each cluster. This helped me surfacing the companies that I have heard of before, adding further narrative to the data.